- Messages
- 40,417
Navigation
Install the app
How to install the app on iOS
Follow along with the video below to see how to install our site as a web app on your home screen.
Note: This feature may not be available in some browsers.
More options
Style variation
You are using an out of date browser. It may not display this or other websites correctly.
You should upgrade or use an alternative browser.
You should upgrade or use an alternative browser.
Climate Change Is The Biggest Threat & Will Kill Us All
- Thread starter Grand Potentate
- Start date
More options
Who Replied?- Messages
- 40,417
http://io9.com/massive-congregation-of-35-000-walruses-linked-to-clima-1641145313
Look at the walruses. LOOK AT THEM...
Look at the walruses. LOOK AT THEM...
- Messages
- 6,461
The comments are great at exposing the baseless fearmongering.http://io9.com/massive-congregation-of-35-000-walruses-linked-to-clima-1641145313
Look at the walruses. LOOK AT THEM...
- Messages
- 6,461
But if you imagine that they are dead, they kind of look like they are dead. And not swimming around.I love the repeated use of the word "catastrophe" to describe walruses resting on a beach as opposed to an ice floe.
The Brian Fellows zoology by the commenters assures us that surely it is horrifically unhealthy for female and young walrii to be so close together. Surely it is worse than if they were far, far apart!
- Messages
- 40,417
I do not understand this reference. What does "Brian Fellows"-ing something imply?The Brian Fellows zoology by the commenters
- Messages
- 6,461
Oop's It turns out that it is Brian Fellow's Safari Planet.
Brian Fellow is not an accredited zoologist, nor does he hold an advanced degree in any of the environmental sciences. He is simply an enthusiastic young man with a sixth grade education and an abiding love for all of God’s creatures…share his love tonight on Brian Fellow’s Safari Planet!
- Messages
- 22,300
Just up the road from me, the world came to view this today. You are all saved. To celebrate, I pulled off my header plugs and drove extra fast.
http://www.theguardian.com/environm...es-on-worlds-first-carbon-capture-power-plant
Environment
Canada switches on world's first carbon capture power plant
Boundary Dam held up as first commercial-scale CCS plant and proof that coal-burning is compatible with cutting emissions
165comments
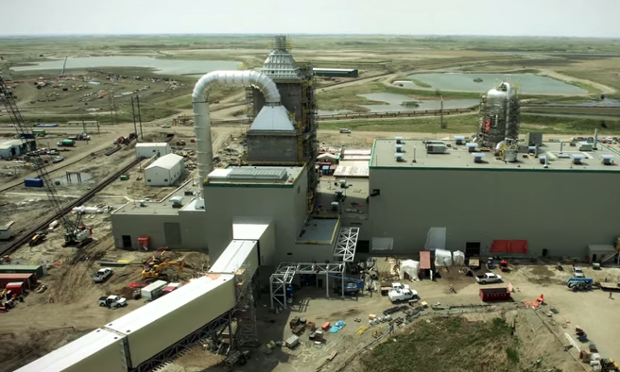
Boundary Dam CCS power plant in Canada. Photograph: SaskPowerCCS
Suzanne Goldenberg
Wednesday 1 October 2014 17.53 BST
Canada has switched on the first large-scale coal-fired power plant fitted with a technology that proponents say enables the burning of fossil fuels without tipping the world into a climate catastrophe.
The project, the first commercial-scale plant equipped with carbon capture and storage technology, was held up by the coal industry as a real life example that it is possible to go on burning the dirtiest of fossil fuels while avoiding dangerous global warming.
Advertisement
Saskatchewan’s state-owned electricity provider is due to cut the ribbon on the $1.3 billion Canadian project on Thursday. But officials from SaskPower International Inc told guests invited to the ceremony the 110 megawatt plant went live on Tuesday night.
The Boundary Dam power plant promises to cut carbon dioxide emissions by 90% by trapping C02 underground before the gas reaches the atmosphere – making its opening a milestone in the coal industry’s efforts to remain viable in a low-carbon economy.
The company said the project would reduce greenhouse gas emissions by about 1 million tons a year, or the equivalent of taking 250,000 cars off the road, in one of the more fossil fuel-dependent regions of Canada.
Advertisement
Captured CO2 from the Boundary Dam project will be pumped underground and sold to the Cenovus oil company for use in priming nearby oil fields, or buried in geological formations.
“Saskatchewan is number one in the world,” said Brad Page, the chief executive of the Global CCS Institute, said. “This is an incredibly important event from our perspective.”
Scientists from the United Nations climate panel said last year that without broad deployment of CCS technology most of the world’s fossil fuel will have to stay in the ground to avoid dangerous climate change.
Page was cautious however in predicting CCS technology deployed at Boundary Dam would soon be replicated on a large-scale.
He noted the Saskatchewan plant relies on a local source of coal – and on selling on the CO2 to the oil industry – to keep it in the black. Coal also faces intense competition from historically low prices for natural gas, which makes it prohibitively expensive to build new coal plants with CCS.
Even so, the opening of Boundary Dam represents a rare success story for the CCS industry.
The technology has not been fully embraced by the big US coal companies – which are still focused on opposingincoming power plant rules from the Environmental Protection Agency.
CCS is also viewed with deep suspicion by environmental campaigners because its economic viability - so far - depends on using the CO2 to increase oil production, and because it is more expensive than renewable sources of energs.
The technology of carbon capture and storage has been around for years. “This is not a moonshot,” Ian Yeates, the SaskPower executive in charge of CCS, told the Guardian earlier this year.
But projects combining power generation and CCS have faced long delays and cost overruns, and run into criticism for receiving government subsidies. A number have been scuttled altogether because of competition from historically low prices for natural gas.
In Mississippi, Southern Company has spent more than $5.5 bn over the last six years trying to bring a new-built CCS project, the Kemper County Energy Facility, into operation. The opening is now delayed until mid-2015.
Only one other CCS project involving power generation is currently on the boards in the US, in Texas.
Boundary Dam claimed its cost over-runs had nothing to do with the CCS technology, but in other construction issues involved in overhauling a 50-year-old power plant. Officials also said they were confident they could bring in the next such CCS project 25% cheaper.
The plant received some CAD$240m in subsidies.
But Yeates acknowledged that at this point the viability of the technology depended on having a nearby source of coal and an additional revenue stream from the enhanced oil recovery. “I think at this stage of the game, because the concept is so new, having a revenue stream from the CO2 is critical to help the economics. But I think eventually that will not be required,” he said.
He said the company had seen a lot of interest in the CCS plant from China, India and other places which have large quantities of similar lignite coal.
“There are 7,000 coal-fired turbines on the planet right now and they are not going to be turned off any time soon because people need the energy they produce,” Yeates said. “Is there going to be enough gas to replace all those units? We are going to be burning fossil fuels as a world economy for many many decades if not a century or two as energy demands grow...something like carbon capture and sequestration will be of value to deal with that.”
Prof Stuart Haszeldine, director of Scottish Carbon Capture & Storage, said: “Boundary Dam is working proof for naysayers, including the Intergovernmental Panel on Climate Change, that full-scale CCS on power generation now exists and works commercially to deliver electricity, with no subsidy.” He claimed the plant’s opening would “create ripples worldwide.”
http://www.theguardian.com/environm...es-on-worlds-first-carbon-capture-power-plant
Environment
Canada switches on world's first carbon capture power plant
Boundary Dam held up as first commercial-scale CCS plant and proof that coal-burning is compatible with cutting emissions
165comments
Boundary Dam CCS power plant in Canada. Photograph: SaskPowerCCS
Suzanne Goldenberg
Wednesday 1 October 2014 17.53 BST
Canada has switched on the first large-scale coal-fired power plant fitted with a technology that proponents say enables the burning of fossil fuels without tipping the world into a climate catastrophe.
The project, the first commercial-scale plant equipped with carbon capture and storage technology, was held up by the coal industry as a real life example that it is possible to go on burning the dirtiest of fossil fuels while avoiding dangerous global warming.
Advertisement
Saskatchewan’s state-owned electricity provider is due to cut the ribbon on the $1.3 billion Canadian project on Thursday. But officials from SaskPower International Inc told guests invited to the ceremony the 110 megawatt plant went live on Tuesday night.
The Boundary Dam power plant promises to cut carbon dioxide emissions by 90% by trapping C02 underground before the gas reaches the atmosphere – making its opening a milestone in the coal industry’s efforts to remain viable in a low-carbon economy.
The company said the project would reduce greenhouse gas emissions by about 1 million tons a year, or the equivalent of taking 250,000 cars off the road, in one of the more fossil fuel-dependent regions of Canada.
Advertisement
Captured CO2 from the Boundary Dam project will be pumped underground and sold to the Cenovus oil company for use in priming nearby oil fields, or buried in geological formations.
“Saskatchewan is number one in the world,” said Brad Page, the chief executive of the Global CCS Institute, said. “This is an incredibly important event from our perspective.”
Scientists from the United Nations climate panel said last year that without broad deployment of CCS technology most of the world’s fossil fuel will have to stay in the ground to avoid dangerous climate change.
Page was cautious however in predicting CCS technology deployed at Boundary Dam would soon be replicated on a large-scale.
He noted the Saskatchewan plant relies on a local source of coal – and on selling on the CO2 to the oil industry – to keep it in the black. Coal also faces intense competition from historically low prices for natural gas, which makes it prohibitively expensive to build new coal plants with CCS.
Even so, the opening of Boundary Dam represents a rare success story for the CCS industry.
The technology has not been fully embraced by the big US coal companies – which are still focused on opposingincoming power plant rules from the Environmental Protection Agency.
CCS is also viewed with deep suspicion by environmental campaigners because its economic viability - so far - depends on using the CO2 to increase oil production, and because it is more expensive than renewable sources of energs.
The technology of carbon capture and storage has been around for years. “This is not a moonshot,” Ian Yeates, the SaskPower executive in charge of CCS, told the Guardian earlier this year.
But projects combining power generation and CCS have faced long delays and cost overruns, and run into criticism for receiving government subsidies. A number have been scuttled altogether because of competition from historically low prices for natural gas.
In Mississippi, Southern Company has spent more than $5.5 bn over the last six years trying to bring a new-built CCS project, the Kemper County Energy Facility, into operation. The opening is now delayed until mid-2015.
Only one other CCS project involving power generation is currently on the boards in the US, in Texas.
Boundary Dam claimed its cost over-runs had nothing to do with the CCS technology, but in other construction issues involved in overhauling a 50-year-old power plant. Officials also said they were confident they could bring in the next such CCS project 25% cheaper.
The plant received some CAD$240m in subsidies.
But Yeates acknowledged that at this point the viability of the technology depended on having a nearby source of coal and an additional revenue stream from the enhanced oil recovery. “I think at this stage of the game, because the concept is so new, having a revenue stream from the CO2 is critical to help the economics. But I think eventually that will not be required,” he said.
He said the company had seen a lot of interest in the CCS plant from China, India and other places which have large quantities of similar lignite coal.
“There are 7,000 coal-fired turbines on the planet right now and they are not going to be turned off any time soon because people need the energy they produce,” Yeates said. “Is there going to be enough gas to replace all those units? We are going to be burning fossil fuels as a world economy for many many decades if not a century or two as energy demands grow...something like carbon capture and sequestration will be of value to deal with that.”
Prof Stuart Haszeldine, director of Scottish Carbon Capture & Storage, said: “Boundary Dam is working proof for naysayers, including the Intergovernmental Panel on Climate Change, that full-scale CCS on power generation now exists and works commercially to deliver electricity, with no subsidy.” He claimed the plant’s opening would “create ripples worldwide.”
- Messages
- 6,461
Does that strike anyone else as sweeping things under a rug?
- Messages
- 9,933
How so?
BTW: again, note the use of the word "catastrophe". Fear sells clicks. How many times have we seen ebola referred to as an epidemic? Let me know when it kills 1% of the world's population. That might get it into the Top 200 worst disease outbreaks ever.
We're out of real problems, or otherwise the problems that exist needing nuanced coverage can neither get the attention of news providers or the people that they seek to 'inform'. Telling complicated stories is expensive.
- Messages
- 6,461
Well, if you accept the idea that the CO2 that we all exhale is an environmental hazard, isn't tucking it underground a bit temporary? Do we really expect it to stay there forever?
- Messages
- 22,300
The best part of this carbon capture plant is that the Sask government has contracts in place with oil companies - which will not be named - to purchase the CO2 to use in aging oilfields to get the oil out.
Clean coal + petroleum FTW!
Clean coal + petroleum FTW!
- Messages
- 6,461
Know we learn that global warming climate change helped ISIS.
http://www.huffingtonpost.com/charles-b-strozier/how-climate-change-helped_b_5903170.html
http://www.huffingtonpost.com/charles-b-strozier/how-climate-change-helped_b_5903170.html
- Messages
- 22,300
Carbon Dioxide here, come and get it! Please subsidize my sorry ass!
http://www.ccsassociation.org/why-ccs/affordability/
As with other forms of low-carbon generation, first-of-a-kind CCS projects will be subject to higher costs and somewhat greater technical uncertainties. They will therefore need additional incentives as – with the exception of some of the low-cost CCS opportunities – they cannot be developed based on current carbon prices. CCS should be treated similar to other low-carbon technologies; it needs only a long-term support structure equivalent to that which has been given to other low-carbon technologies in recent years.
Does carbon capture cause problems? Maybe. No one knows. I like this fact sheet from the Pembina Institute Think Tank (read politically co-opted outfit purporting to be free thinkers. Don't worry if they are left or right wing, just that they have a wing).
http://www.pembina.org/reports/ccs-fact-sheet.pdf
Potential Problems:
The other point is where do we store all this great CO2? There are indeed ideas including deep saline aquifers, as well as depleted gas, oil and bitumen reservoirs. So, storage sites are finite? That is why there has to be an economic value for all this stored CO2.
I once had a problem with pests. Cobras to be specific. I brought in snake charmers from India but the cold here made it difficult to play their flutes effectively with gloves on and the cobra problem persisted. I brought in Mongoose (Mongeese? Mongooses?) and they took care of the Cobras. What to do with the Mongoose? Of course, they were eaten by the snake charmers. Now what to do with all these snake charmers? started a taxi company of course.
You gotta have a plan.
http://www.ccsassociation.org/why-ccs/affordability/
As with other forms of low-carbon generation, first-of-a-kind CCS projects will be subject to higher costs and somewhat greater technical uncertainties. They will therefore need additional incentives as – with the exception of some of the low-cost CCS opportunities – they cannot be developed based on current carbon prices. CCS should be treated similar to other low-carbon technologies; it needs only a long-term support structure equivalent to that which has been given to other low-carbon technologies in recent years.
Does carbon capture cause problems? Maybe. No one knows. I like this fact sheet from the Pembina Institute Think Tank (read politically co-opted outfit purporting to be free thinkers. Don't worry if they are left or right wing, just that they have a wing).
http://www.pembina.org/reports/ccs-fact-sheet.pdf
Potential Problems:
- Dissolved subsurface CO2 may affect groundwater chemistry.
- Fluids displaced by injected CO2 may contaminate drinking water, damage mineral resources, or induce seismicity.
- Storage leaks could lead to potentially dangerous concentrations of CO2 in a local area, posing a threat to human, animal and plant health.
- Pipeline leaks may pose localized risks similar to those from existing hydrocarbon pipelines.
The other point is where do we store all this great CO2? There are indeed ideas including deep saline aquifers, as well as depleted gas, oil and bitumen reservoirs. So, storage sites are finite? That is why there has to be an economic value for all this stored CO2.
I once had a problem with pests. Cobras to be specific. I brought in snake charmers from India but the cold here made it difficult to play their flutes effectively with gloves on and the cobra problem persisted. I brought in Mongoose (Mongeese? Mongooses?) and they took care of the Cobras. What to do with the Mongoose? Of course, they were eaten by the snake charmers. Now what to do with all these snake charmers? started a taxi company of course.
You gotta have a plan.
- Messages
- 22,300
Leaking CO2 causes similar problems to leaking oil. Um..... well, I'd question this, but "it's fucking science" and therefore unassailable.
that is the thing. these capture/storage facilities are just being built and coming on line so no one knows what any long term effects might be. The science is being manipulated by both the fossil fuel side and the environmental organization side which once again leads to confusion of the public.
Jan Libourel
Well-Known Member
- Messages
- 875
I have a friend who held a fairly high position in the Environment Protection Agency (I think that's what "EPA" stands for, anyway before he retired. I asked him his opinion about this global warming business a few years ago. HIs answer was immediate and emphatic: "Total fraud."
Things were seemingly a good deal warmer a mere 80,000 years ago, when humans were around, and we got through that just fine and went on to conquer the earth!
Things were seemingly a good deal warmer a mere 80,000 years ago, when humans were around, and we got through that just fine and went on to conquer the earth!
- Messages
- 6,461
http://www.cnsnews.com/news/article...annel-founder-man-made-global-warming-baloney
Weather Channel Founder: Man-Made Global Warming is ‘Baloney’
- Messages
- 21,601
Is it?
Weather sure is getting crazy though. Maybe it'll freeze over like Day After Tomorrow.
Weather sure is getting crazy though. Maybe it'll freeze over like Day After Tomorrow.
- Messages
- 40,417
LelandJ
Chicken Testicle Enthusiast
- Messages
- 6,002

LelandJ
Chicken Testicle Enthusiast
- Messages
- 6,002

LelandJ
Chicken Testicle Enthusiast
- Messages
- 6,002
Sorry you guys are unaware how bad anthropogenic global warming is.
Human and most mammal extinction is already baked in, just don't know if our lifetime or children's lifetime.
Human and most mammal extinction is already baked in, just don't know if our lifetime or children's lifetime.
LelandJ
Chicken Testicle Enthusiast
- Messages
- 6,002
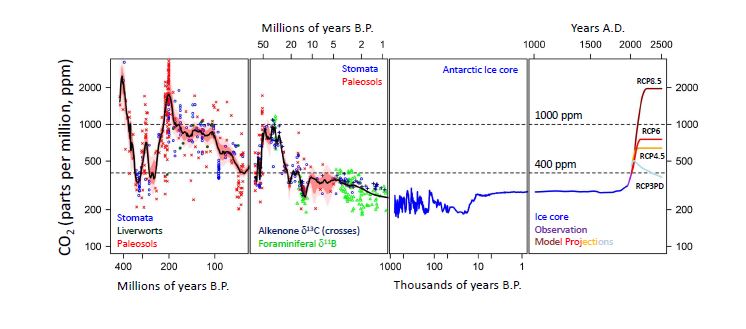
Figure 1: Compilation of available CO2 data for the last 450 million years. For data sources see text. Proxy records are colour coded and labelled in the relevant panel. Greenhouse gas emission scenarios (RCP – Representative Concentration Pathways) used in IPCC AR5 are shown in the right hand panel. Note the variable log scale for time. For the geological data a smoothed line has been fit to the data with an uncertainty accounting for uncertainty in age and CO2. The black line describes the most probable long-term CO2 with 68% confidence limits in red, and 95% confidence in pink.

Figure 2: Climate forcing by changing CO2 and solar output for the last 450 million years. CO2 data and projections are as outlined in Figure 1. Changing solar output calculated as described in Gough et al. (1981; Solar Physics, 74, 21-34) with CO2 forcing from Byrne and Goldblatt (2014; doi: 10.1002/2013GL058456). The red band is the 95% confidence interval around the smoothed line through the published CO2 data.
We're on the RCP 8.5 track, meaning we're changing CO2 in 100 years the same amount with the last historical precedence which took 60 million years.
LelandJ
Chicken Testicle Enthusiast
- Messages
- 6,002
Uhh, they've been making predictions for many decades and climate history's been worse than all the worst case predictions so far, scientists like to err on the conservative side. Surely you're not foo-ish enough to assert your heating bills as counter evidence.
- Messages
- 40,417
I know you're drunk but honestly, I expect better from you than this.Bull fucking shit. The brainwashed can't lie about this anymore, I can look at my heating levels from last year now and this year is cooler so far than last year. And cooler than the last ten years except 2012. It's not global warming. Stop it.
LelandJ
Chicken Testicle Enthusiast
- Messages
- 6,002
Your foaming at the mouth is charming but I see why you were banned from SF. :facepalm2:
LelandJ
Chicken Testicle Enthusiast
- Messages
- 6,002
I don't believe in banning anyone who defends horsefuckers.
LelandJ
Chicken Testicle Enthusiast
- Messages
- 6,002
Is there another earth to test on?
LelandJ
Chicken Testicle Enthusiast
- Messages
- 6,002
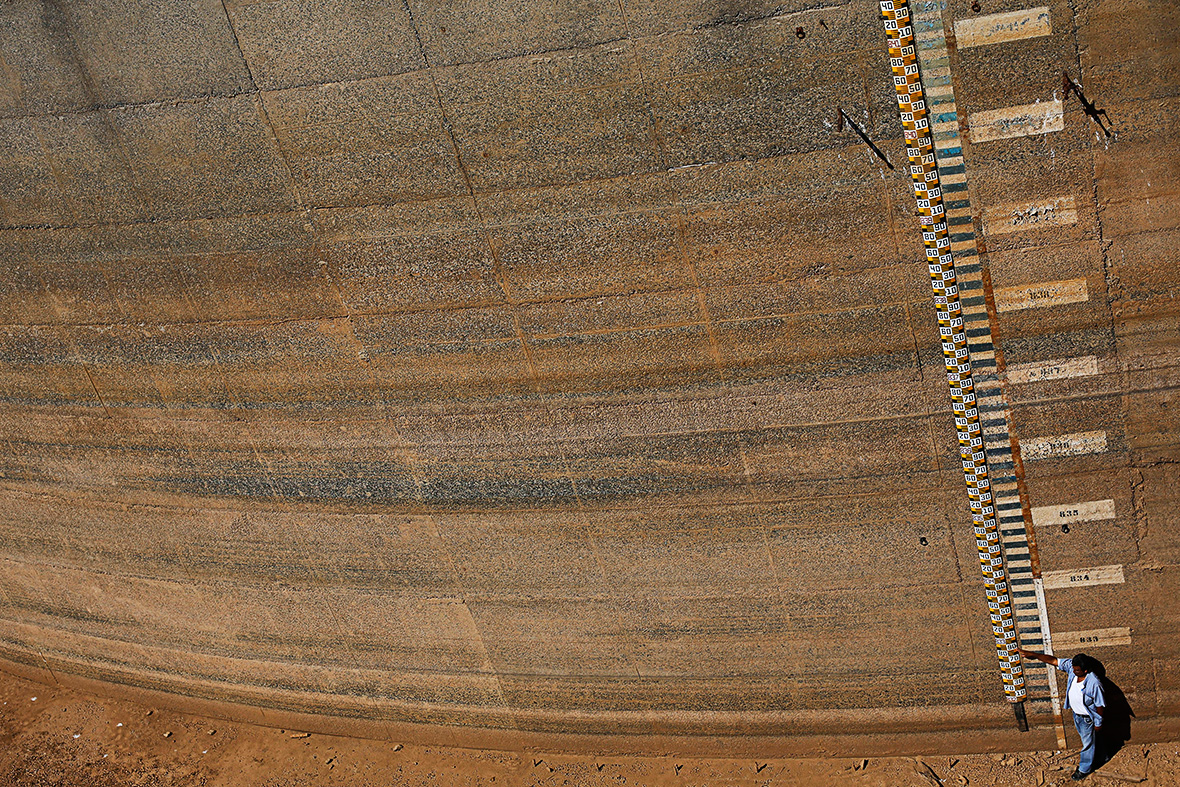
Brazil has the largest freshwater reserves in the world, yet Sao Paolo, South America's biggest city of 20 million people, is on track to run out of water within a few months due to catastrophic drought over the past year.
Possibly a humanitarian crisis of unprecedented proportion from global warming. How many days can a human live without water? Of course you won't see this on CNN until after the city runs totally dry.
http://www.ibtimes.co.uk/brazil-wor...sao-paulo-may-run-out-water-two-weeks-1472127
http://www.bloomberg.com/news/2014-...azil-drought-leads-to-fight-over-puddles.html
- Messages
- 40,417
Fascinating links. Thanks for sharing.
LelandJ
Chicken Testicle Enthusiast
- Messages
- 6,002
Do the Math ...
Cantareira Reservoir System - 6.5 million people
Nov 14 - 10.8%
Nov 21 - 9.7%
1 week - -1.1%
Alto Tietê Reservoir System - 4.0 million people
Nov 14 - 7.5%
Nov 21 - 6.4%
1 week - -1.1%

Would like to drop JimmyRustler there before zero water.
Cantareira Reservoir System - 6.5 million people
Nov 14 - 10.8%
Nov 21 - 9.7%
1 week - -1.1%
Alto Tietê Reservoir System - 4.0 million people
Nov 14 - 7.5%
Nov 21 - 6.4%
1 week - -1.1%
Would like to drop JimmyRustler there before zero water.
- Messages
- 1,290
So Zero Water is the next big crisis we have to fabricate in order to generate awareness of environmental issues or (worse) use our awareness of to try to acquire superior social status? Or is it just to fill the winter months, when descriptions of the horrors of a warmer planet ring especially hollow?
It's sad we have to use this stupid shit.
It's sad we have to use this stupid shit.
- Messages
- 22,300
Do the Math ...
Cantareira Reservoir System - 6.5 million people
Nov 14 - 10.8%
Nov 21 - 9.7%
1 week - -1.1%
Alto Tietê Reservoir System - 4.0 million people
Nov 14 - 7.5%
Nov 21 - 6.4%
1 week - -1.1%
Would like to drop JimmyRustler there before zero water.
The worst drought in 80 years. So there have been worse ones. This is about deforestation and mismanagement of water resources
- Messages
- 22,300
yup. global warming climate change. dumbass Brazilians
LelandJ
Chicken Testicle Enthusiast
- Messages
- 6,002
I don't even understand the allegation there. Sao Paulo is undergoing a drought, ok, it happens all the time all over the world. This drought is caused by climate change? Ok, Mesopotamia was once a tropical paradise, these things happen. I'm supposed to give two fucks about some third world country where virtually the entire population is infected by bugs that make them horny as shit and are only behind the Phillipines in Sexual reassignment surgeries? Why?
Crazy how a third world city has rent prices at NYC levels. :roll:
So Zero Water is the next big crisis we have to fabricate in order to generate awareness of environmental issues or (worse) use our awareness of to try to acquire superior social status? Or is it just to fill the winter months, when descriptions of the horrors of a warmer planet ring especially hollow?
It's sad we have to use this stupid shit.
It's summer in the southern hemisphere. :facepalm2:
- Messages
- 1,290
Crazy how a third world city has rent prices at NYC levels. :roll:
It's summer in the southern hemisphere. :facepalm2:
 Do you actually you think the Aussies and Kiwis carry the same weight, politically speaking, as North America, Europe, and China?
- Messages
- 40,417
http://www.cnn.com/2014/11/30/tech/innovation/record-temperatures/index.html?hpt=hp_t2
NOAA: 2014 is shaping up as hottest year on record
(CNN) -- The first ten months of 2014 have been the hottest since record keeping began more than 130 years ago, according to data from the National Oceanic and Atmospheric Administration.
That may be hard to believe for people in places like Buffalo, New York, which saw a record early snowfall this year.
But NOAA says, despite the early bitter cold across parts of the United States in recent weeks, it's been a hot year so far for the Earth.
With two months left on the calendar, 2014 is shaping up to be the hottest year on record.
The average global temperature between January and October has been 0.68 degrees Celsius (1.22 degrees Fahrenheit) higher than the 20th century's average global temperature of 14.1 C (57.4 F).
NOAA's analysis is an important "health gauge" indicating an ominous trend for the planet, says CNN meteorologist Derek Van Dam.
"It's becoming increasingly more difficult to be a skeptic of the causes of our warming planet," he says.
Hottest October
This October was the hottest October on record globally, NOAA data showed. The mercury climbed more than one degree Fahrenheit above the 20th century average of 57.1 F.
It was the fourth warmest October on record for the United States, NOAA said.
"The record high October temperature was driven by warmth across the globe over both the land and ocean surfaces and was fairly evenly distributed between the Northern and Southern Hemispheres," the agency said.
That's significant, says Van Dam.
"Most notably, this record warmth is not contained to any specific part of the world. Meaning, we are all in this together," he says. "So far this year, record-breaking warmth has been observed in at least every continent and major ocean basin of our planet. This is something we cannot ignore."
Important benchmark
NOAA's analysis breaks down global temperatures into two categories -- land and ocean -- then an average that includes both. The record high temperatures in October were recorded across both land and sea.
The surface temperature on land approached an important scientific benchmark. It was almost 2 degrees Celsius higher than the 20th century average for October of 9.3 C (48.7 F).
Scientists have long predicted that a change in global average temperature of just 2 to 3 degrees higher could spell disaster for the planet, contributing to catastrophic storms, sea level rise, dangerous storm surges and melting polar ice.
According to the non-binding international agreement on climate change -- the Copenhagen Accord, reached in 2009 -- any temperature increase above the 2 degree Celsius mark is "dangerous."
NOAA said the ocean temperatures were also the warmest on record in October with an increase of 1.12 F over the 20th century average of 60.6 degrees.
Hot spots
"Record warmth for the year-to-date was particularly notable across much of northern and western Europe, parts of Far East Russia, and large areas of the northeastern and western equatorial Pacific Ocean, " NOAA said. "It is also notable that record warmth was observed in at least some areas of every continent and major ocean basin around the world," the agency added.
Of particular note, several countries have already seen an average temperature increase of more than 2 degrees Celsius in October 2014 compared to 20th century averages, including Australia, Germany, France, Switzerland, and Sweden.
There was also one notable cold spot on the map.
The average temperature this year in the midsection of the United States, which saw a severe winter, has been below the 20th century average.
LelandJ
Chicken Testicle Enthusiast
- Messages
- 6,002
But how old is the universe?
- Messages
- 40,417
I thought it was 6000?7,000 years, duh. Dinosaur bones were put there to test our faith.
- Messages
- 9,933
Bull fucking shit. The brainwashed can't lie about this anymore, I can look at my heating levels from last year now and this year is cooler so far than last year. And cooler than the last ten years except 2012. It's not global warming. Stop it.
Now, please continue to lie about climate change but until one of these lying fuckfaces can actually predict something they are wrong. Wrong.
You need more information cuz you're dead fucking wrong.
Heating and cooling bills do not a story tell. Not all politics is local.
- Messages
- 9,933
officepants- So how do you define anomalies and statistical significance in relation to data with changing precision and increasing size? Because it's obvious you think you know what you're talking about.
The climate science has, for decades now, predicted more extremes in weather patterns. The denial crowd loves to point at the cold snaps and laugh at "global warming" but unfortunately they don't realize this is EXACTLY the kind of weather pattern behavior that indicates a climatic change is taking place. And yes, it's warming.
The jet stream is slowing. This explains the "polar vortex" embraced by both the left and right for different reasons. Again, because the jet stream is slowing down. And that's because the poles are warmer. But hey, Fox News says it's bullshit. So you can believe that or an overwhelming number of scientists.
Users who are viewing this thread
Total: 2 (members: 0, guests: 2)